This article will give a brief overview of some performance troubleshooting techniques for SQL Server.
Diagnosing Server Performance Bottlenecks
For troubleshooting general server performance as a whole, we should be looking for a bottleneck involving one of the following resources:
- CPU
- Memory
- File I/O
- Locking
Some Basic Best Practices Checks
Before doing too much troubleshooting, it is a good idea to verify a few best practices are in place that can dramatically affect server performance.
-
Verify all vCPUs assigned to the server is being utilized by SQL Server.
Check the CPU graphs in the Task Manager in Windows. Split up the graph to show the individual vCPUs. If there are 1-4 vCPUs heavily utilized while the rest are almost idle, then SQL Server may not be fully utilizing all the vCPUs. The first thing to check in this case is whether the vCPUs are being presented to the OS as Sockets or Cores. If they are being presented as separate sockets, schedule a maintenance period to have them adjusted to be presented as cores. The other thing to note is that the Express edition of SQL Server is always limited to utilizing a maximum of 4 cores.
-
Verify the tempdb has been split into at least 4 separate data files.
Due to how locking occurs on the tempdb, having too few data files can severely affect concurrency for queries with large intermediate result sets that utilize the tempdb. By adding additional data files to the tempdb, you can allow more queries to utilize the tempdb simultaneously. Our recommendation is to start with 4 data files and increase beyond that if further investigation leads you to believe the tempdb is a source of contention.
-
Ensure all databases have the auto_close_ setting disabled.
When enabled, the auto_close setting causes SQL Server to automatically unload a database when all its connections are closed, which can cause unnecessary loading and unloading of a database. Since modern SQL clients utilize long-term connection pooling, this is not generally as big of an issue as it once was. However, there are a few SQL clients that close connections when a request completes, which can cause the database to be loaded, unloaded, loaded, unloaded, etc. In either case, disabling this setting is always recommended.
CPU
For CPU, there are a few possible bottlenecks:
-
Overall CPU usage is high.
- This is simple to check. Open the Task Manager in Windows and see if the CPU usage is close to 100%.
-
The CPU capacity of the server is too low.
- To diagnose this, try running a query that is performing poorly. If the CPU usage spikes up and remains close to 100% while the query executes, its speed is likely being limited by the CPU capacity available to the server.
Memory
For memory, I recommend checking the Page Life Expectancy counter using the following query:
SELECT [object_name], [counter_name], [cntr_value]
    FROM sys.dm_os_performance_counters
    WHERE [object_name] LIKE '%Manager%'
      AND [counter_name] = 'Page life expectancy'
If the counter is below 300 seconds, then the SQL Server may not have enough memory for caching. If there is available memory in the operating system, you can increase the cache size via SQL Server Management Studio in Server Properties → Memory → Maximum Server Memory.
Additionally, If you frequently read a small set of rows from a large table, adding indexes can reduce the memory needed for caching. When SQL Server must scan an entire table to complete a query, that entire table gets put into the cache. This can cause other active data to be removed from the cache, forcing it to be read from disk the next time it is accessed. Adding an index allows SQL Server to complete the query by reading only those rows that are needed, preventing the entire table from being read and cached and thus reduces the amount of cache space needed.
File I/O, Locking, and other related issues
To diagnose these issues, it is best to start looking at the SQL Server wait statistics. The following article has a great script for checking the wait statistics that will also provide links for more information on each type of wait:
Checking the provided links for the top wait statistics can be helpful in determining the next steps in addressing these potential issues.
Tracking Down Expensive Queries at the Server Level
After identifying which resource is the bottleneck for performance, it can be useful to look for expensive queries that are contributing to that bottleneck to see if they can be optimized.
Below is a query you can use to find the most expensive queries based on CPU usage (worker_time), I/O Read (logical_reads), or I/O Writes (logical_writes)
SELECT TOP 10 SUBSTRING(qt.TEXT, (qs.statement_start_offset/2)+1,
		((CASE qs.statement_end_offset
		WHEN -1 THEN DATALENGTH(qt.TEXT)
		ELSE qs.statement_end_offset
		END - qs.statement_start_offset)/2)+1) AS query,
		DB_NAME([qp].[dbid]) AS [database_name],
		qs.total_worker_time,
		qs.total_logical_reads,
		qs.total_logical_writes,
		qs.execution_count,
		qs.total_elapsed_time/1000000 total_elapsed_time_in_S,
		qs.last_execution_time,
		qp.query_plan
	FROM sys.dm_exec_query_stats qs
		CROSS APPLY sys.dm_exec_sql_text(qs.sql_handle) qt
		CROSS APPLY sys.dm_exec_query_plan(qs.plan_handle) qp
	-- ORDER BY qs.total_logical_reads DESC -- logical reads
	-- ORDER BY qs.total_logical_writes DESC -- logical writes
	ORDER BY qs.total_worker_time DESC -- CPU time
Simply uncomment the metric you are interested in on the last three lines and comment out the other two to order by the specific metric. Executing as-is above will order by CPU usage.
The last column presented by this query is the query_plan. If you are using the latest version of SQL Server Management Studio, this column will be presented as a clickable link that will show you the estimated execution plan of the query. This can help you identify which part of the query is the most resource intensive and will also sometimes automatically suggest an index that can be added to increase performance.
By addressing the highest resource consuming queries, you may be able to improve the overall performance of your SQL server without needing to add resources. However, you may have noticed that memory usage is not addressed here. This is because the memory used is dependent on the amount of data being queried and not the queries themselves. If your SQL instance is memory starved, you will likely either need to remove data from the database that is no longer needed or add more memory.
Application Performance
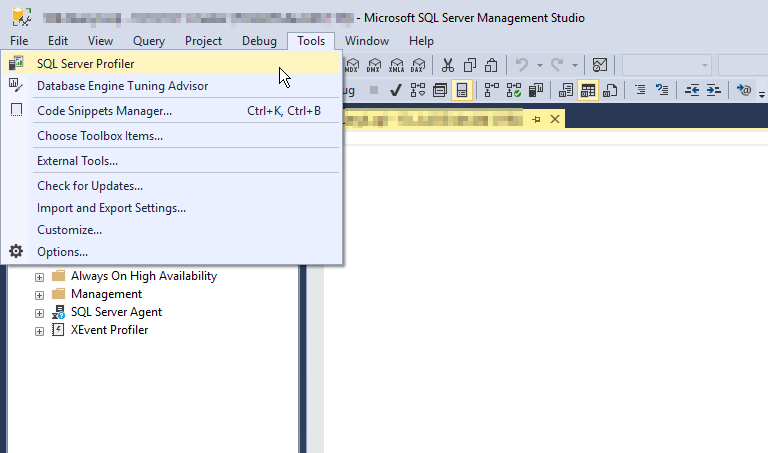
If you want to improve the performance of an application where you can reproduce the issue, such as a slow-loading page, a great tool for the job is the SQL Server Profiler, which is available from the Tools menu in SQL Server Management Studio.
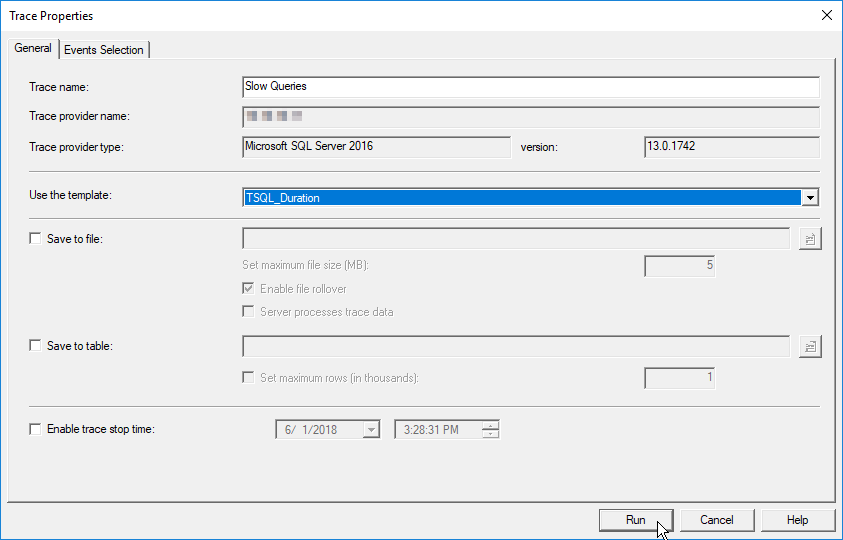
I recommend starting with the TSQL_Duration template to diagnose slow requests as that will group the longest running queries at the bottom of the profiler output.
You should get output similar to the following image. Clicking on a query execution from the list will show the full query in profiler window.
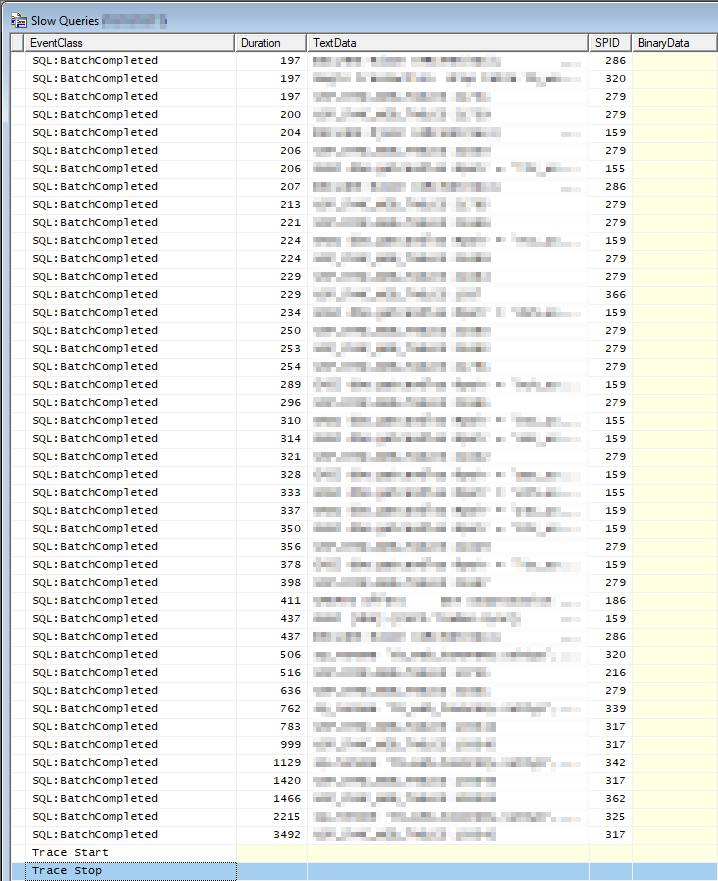
If you need to track down which database the query was run against or which user initiated the query, you can use the SPID column to find the session in the [sys].[sysprocesses] system view. Example:
SELECT [spid], DB_NAME(dbid) AS [db_name], [login_time], [status], [hostname], [program_name], [hostprocess], [loginame] FROM [sys].[sysprocesses] WHERE [spid] = 12345;
If you can optimize the slowest queries, you should significantly improve the overall performance of your application.
Improving a Slow Query
When you have a single query that is performing slowly, start by looking at the estimated execution plan within SQL Server Management Studio. This can be done by pasting the query in a New Query tab, right-clicking on the query window, and choosing Display Estimated Execution Plan.
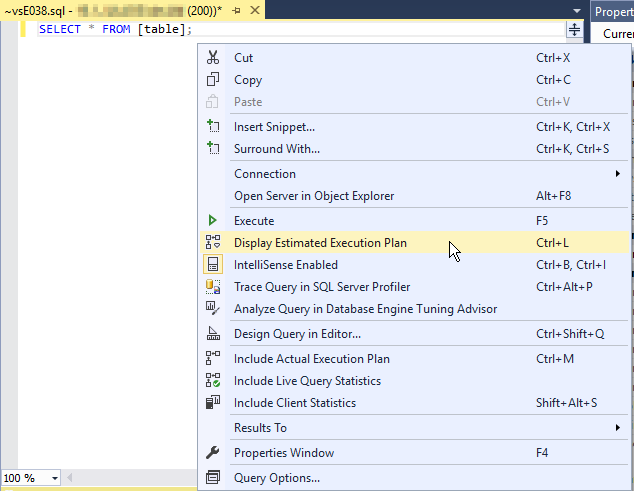
The estimated execution plan will give you an idea where most of the cost of the query is coming from. The system will also sometimes suggest an index that can be added to improve the performance of the query.
A couple things to look for in the execution plan:
-
Table Scan or Clustered Index Scan: This indicates that SQL Server had to read/scan the entire contents of the table because it was unable to utilize an index. When an index is used, it will be listed as an Index Seek.
-
Sort: Sorting can sometimes be avoided if your Index is already sorted in the correct order.
As a very general rule, you can avoid table scans by ensuring an Index exists for any columns used in a JOIN or WHERE condition. Additionally, when you have multiple conditions in the WHERE clause, a multi-column index can sometimes often even further performance. However, adding too many indexes can slow down updates and consume more space and memory, so there is a balance that should be made between adding needed indexes and avoiding unnecessary ones.
Additionally, if the query performs any SQL functions on columns in the WHERE clause, indexes for those columns become unusable since the comparison is being made on the result of the SQL function rather than the original value of the column. Example:
SELECT * FROM [example] WHERE UPPER(TRIM([title])) = 'EXAMPLE_TITLE';
In the above query, any index on the [title] column would be unusable for the query since the SQL functions are changing the value of the column before performing the equality check.